

Analyzing metrics from thousands or millions of clients typically requires aggregations for downstream analysis.
For example, timing metrics such as request latency would typically compute percentiles, average, standard deviations and then push the result to a system for visualization. See Graphite and Grafana for a standard event flow.
Client and server aggregation workflow
Ideally the client sending metrics would emit the event as soon as it occurred. However it is often not practical as it would require a very large and costly backend deployments to field all requests. Especially if the number of clients is in the thousands or millions.
The alternative is to batch up (or buffer) metrics in the client to decrease the request rate. The problem with this approach is when your downstream aggregation service flushes the aggregate values based on processing-time rather than client time.
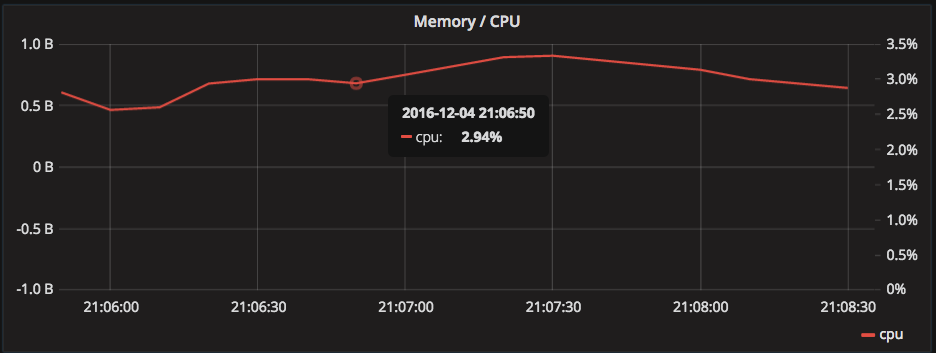
The server flushes exactly one data point per computed aggregate using the timestamp at the end of the flush interval. The following example shows the average cpu utilization over a 10 second flush interval.
The problem with processing-time (or arrival-time)
There are two variables that are responsible for the accuracy when computing aggregations using the processing-time:
- Client flush interval
- Server flush interval
Note that I’m defining accuracy as a mapping: from the time that the event occurred (on the client) onto the server flush interval. In other words, did the client generated event make it into correct server flush interval?
Let’s try to illustrate the problem by having client(s) track 1 event every second and then push all 3 events every 3 seconds.
If we assume there there is a slight delay between the client and server then the first interval of data from the client will be pushed into the t=[4..6) server flush interval.
That means the client flush interval t=[1..3] has 3/3 events in the wrong flush interval. In other words, all 3 events should have been aggregated in the server flush interval t=[1..3) instead of t=[4..6).
Additionally, the client flush intervals t=[2..4] and t=[3..5] also have 2/3 events and 1/3 events in the wrong flush interval. That is about 6/9 events in the wrong server flush interval, or 3/9 events in the correct flush interval.
Mitigation strategies
It turns out that the batch interval and flushing intervals determine the accuracy of the aggregated metrics.
If we double the server flush interval then we actually get more events in the correct buckets.
| Client flush interval | Server flush interval | % metrics in correct flush interval |
|---|---|---|
| 3 seconds | 3 seconds | ~3/9=~33% |
| 3 seconds | 6 seconds | ~6/15=~40% |
| 3 seconds | 9 seconds | ~18/24=~75% |
Indeed we could decrease the client flush interval or increase the server flush interval and it would yield the same affect of improving accuracy.
Using client time (instead of processing-time) for aggregations
Another option is to generate events with client timestamps and then aggregate based on those timestamps.
The problems with this approach:
- It is non-trivial to deal with early and late arriving events. You’ll need to store and update aggregated state as new events arrive.
- You are trusting that all clients are configured in the right timezone. Depending on your requirements this may or may not be an issue.
Keeping track of state as data arrives can be accomplished through a stream processing solution. For further details, I’d recommend taking a look at Apache Spark or Kafka Streams.